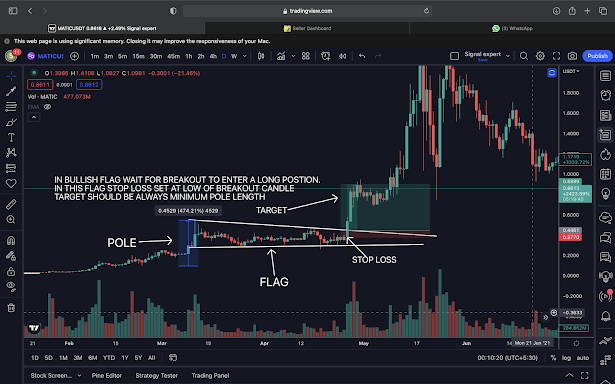
Flag and pole chart (Bullish)
*When there is a pole and forming a flag in the chart in continuation pattern then it’s a good opportunity to take a trade.
*Whenever market is moving in uptrend then you can see market is going bullish then going sideways for some time and making flag then breaking out and then bullish again, so you can find flag again and again in short time period like (30min,1hr,2hr,4hr).
*If flag is breaking out with good volume in it then you can take a trade after the breakout and retest of that flag.
*You can enter the trade after a candle make a breakout then wait for next green candle upwards the flag next green candle is good for entry.
Where to put Target
*You can put target according to your pole height of pole or the medium of pole.
Where to put Stop loss
*Stop loss to be marked at below the candle that is breaking out the flag.Chart for bullish Flag
Flag and Pole (Bearish)*When there is pole and forming a flag in bearish continuation pattern then it’s a good time to take entry for a bearish (short) trade.
*Whenever market is moving bearish then it will breakdown strongly, then going sideways and making a flag for another breakdown, so you can find flag many times in short period like (30mins,1hr,2hr,4hr).
*If you see flag is breaking down with good volume in it then you can short trade from where the flag is breaking down.
*After breaking down the flag if there is a red candle then you can short it from there as shown in chart provided below.
Where to put Target
*Target should be put half of the pole that is make before the flag and you can put target to height of the pole if it hits half pole target and then breakout again.
Where to put Stop loss
*Stop loss to be put at the height of candle that is breaking down the flag.
Chart for bearish Flag


Add a Comment